Chapter 2: Section 5 Notes
By the end of the section, you should be able to:
- Draw a trend line through a plotted set of data.
- Find the equation of a given trend line.
- Inspect a set of data and describe its correlation (positive/negative, strong/weak, no correlation).
- Make predictions from a set of data using a trend- line or line of best fit.
Definitions:
- Scatter Plot: a graph that relates two sets of data by plotting the data as ordered pairs.
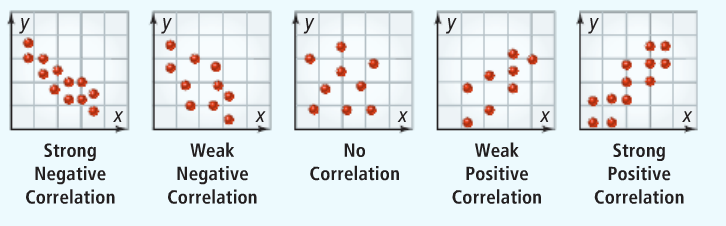
- Correlation: the strength of the relationship between data sets.
- the closer the data points fall along a line, the stronger the relationship between the two variables.
- Strong relationships are strong correlations
- Weak relationships are weak correlations.
- Strong relationships are strong correlations
- the closer the data points fall along a line, the stronger the relationship between the two variables.
- Outlier: a point that is distinctly separate from the rest of the data.
- Trend line: a line that approximates the relationship between the variables, or data sets, of a scatter plot.
- Line of best fit: the trend line that gives the most accurate model of related data.
- This is found using the linear regression capabilities of a graphing calculator.
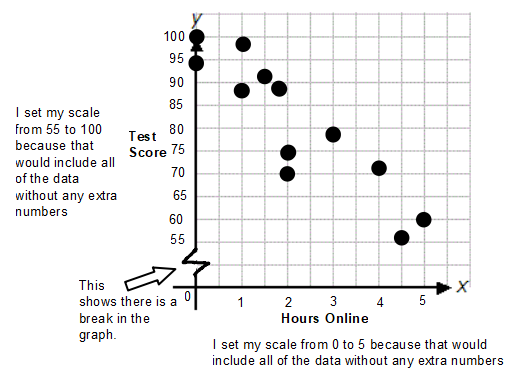
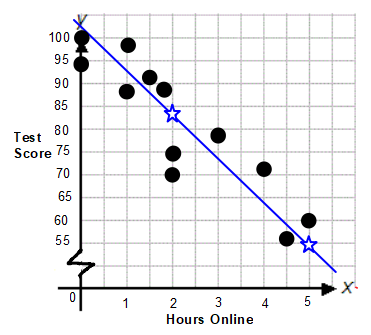
Creating a Scatter Plot
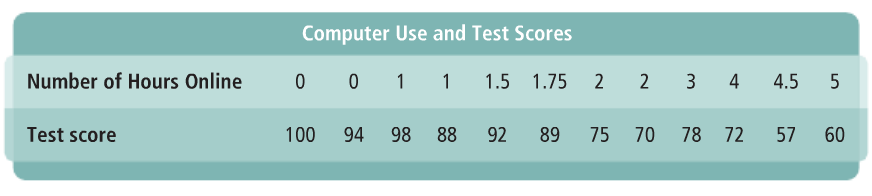
We want to see how Number of Hours Online effects
Test Scores.
Step 2: Plot your points on the graph
|
|
Analyzing Scatter Plots
|
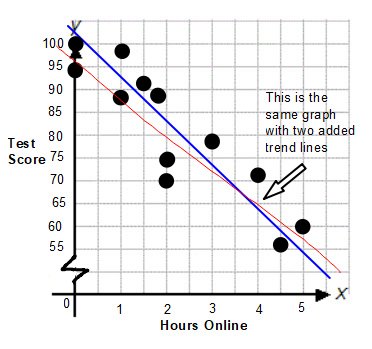
Step 1: Draw a Trend Line
When drawing trend lines:
|
|
Step 2: Describe the Correlation
|
Step 3: Analyze the Correlation
Pick two points on the trend line you drew and create a linear equation using point-slope form. |
|
Using this linear equation we now have a model to predict test scores based off of hours spent online.
Line of Best Fit
The line of best fit
We will be using Desmos as the graphing calculator in our class. The following links will give you a worked out example and has an option of a tutorial online so that you can learn how to use the linear regression capabilities yourself.
Worked out Example/Video: https://support.desmos.com/hc/en-us/articles/202532159-Regressions
Tutorial: https://www.desmos.com/calculator?tour=regressions
|
Step 1: Insert a Table
Step 2: Create an expression
|

|
Section 2.5 Worksheet |
Section 2.5 WS Answers |
If you had any problems with the example videos on this page, or have any comments to make them better, please click the button below.
