Chapter 2: Section 8 Notes
By the end of the section, you should be able to:
- Graph two variable linear inequalities.
- Graph two variable absolute value inequalities.
Definitions:
- Linear Inequality: an inequality in two variables whose graph is a region of the coordinate plane bounded by a line
- Boundary: the line that separates the coordinate plane into two half-planes.
- Half-Plane: the section of the coordinate plane that includes the solutions to the linear inequality, or the section that does not include the solutions.
- Test Point: a point that is NOT on the boundary line that is used to see which half-plane shows the solutions of the linear inequality.
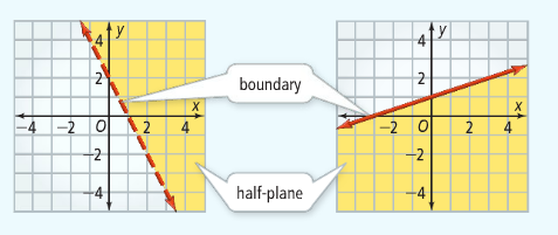
The shaded half-plane is the region where the solutions to the linear inequality exist.
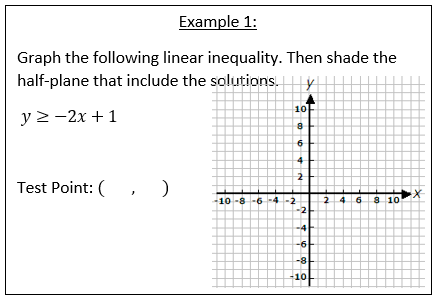
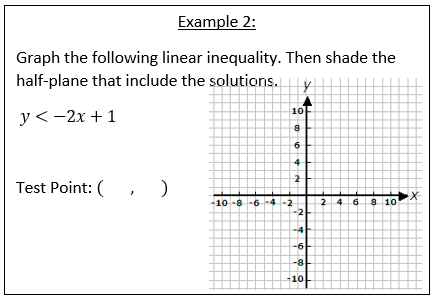
Steps for Graphing Two Variable Inequalities
- Graph the Boundary Line
- Dotted line - - - for
- Solid line _____ for
- Choose a test point
- Plug point into function to see if the point is a solution.
- Shade the correct side of the boundary line
- If the test point was a solution, shade the side where the test point IS located.
- If the test point was NOT a solution, shade the side OPPOSITE of the test point.
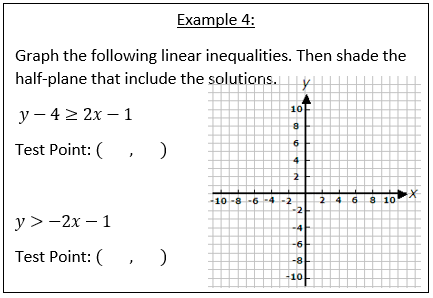
Examples of Graphing Two Variable Inequalities
|
|
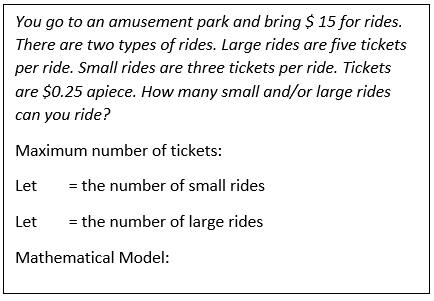
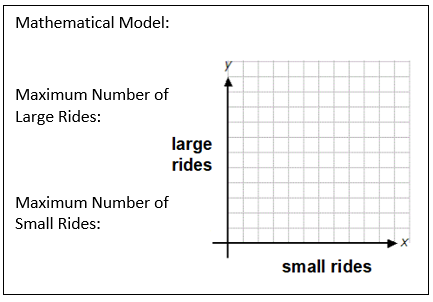
Examples of modeling/solving real world problems with two variable inequalites
|
|
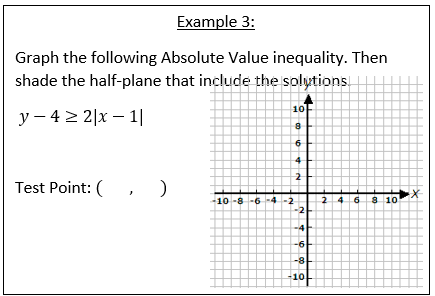
Examples of Graphing Absolute Value Inequalities
|
|
A2 Section 2.8 Worksheet |
A2 Section 2.8 WS ANSWERS |
If you had any problems with the example videos on this page, or have any comments to make them better, please click the button below.
