Chapter 2: Section 7 Notes
By the end of the section, you should be able to:
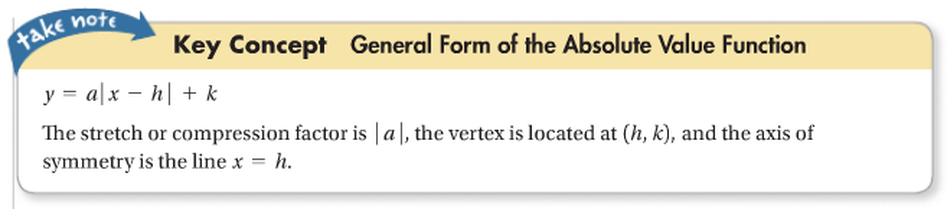
- Describe the transformations of an Absolute Value Equation using the general form ( y = a | x - h | + k)
- Graph two variable absolute value equations.
Definitions:
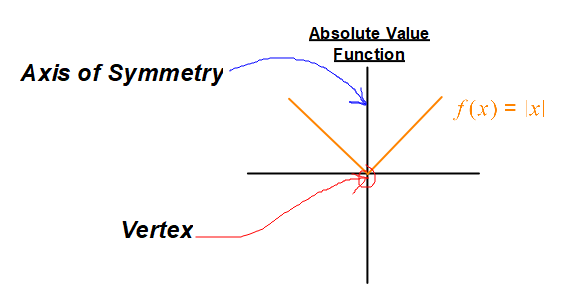
- Absolute Value Function: written as f(x) = |x| the output value will show the distance of the input value from away from the line y = 0.
- The output value will always be positive
- The graph will look like a “V”
- Axis of Symmetry: the vertical line that is in the middle of a symmetric function.
- Vertex: the single maximum/minimum point ( h , k )of an absolute value function.
The general graph of an Absolute Value Function in Two Variables
General form of an Absolute Value Function (with translations)
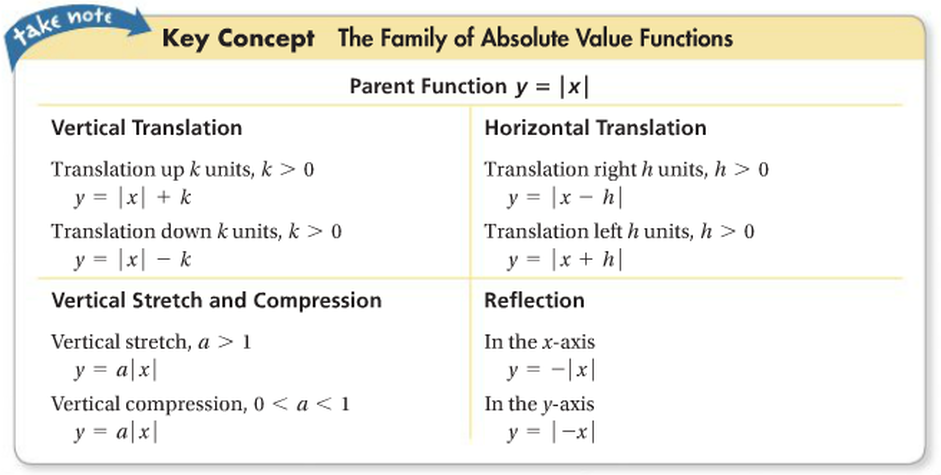
Translations of an Absolute Value Function in Two Variables
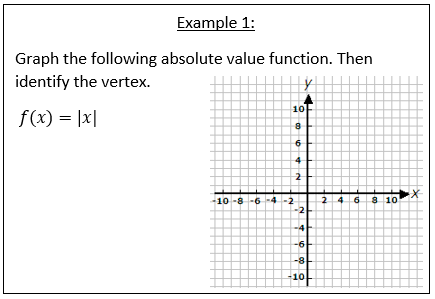
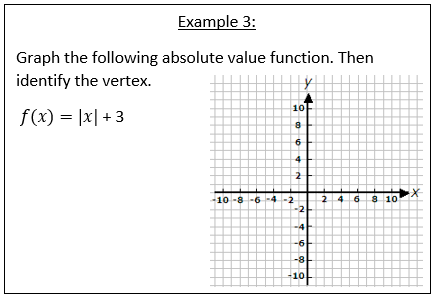
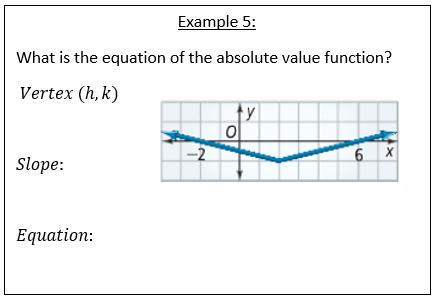
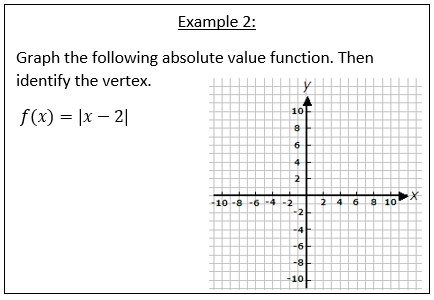
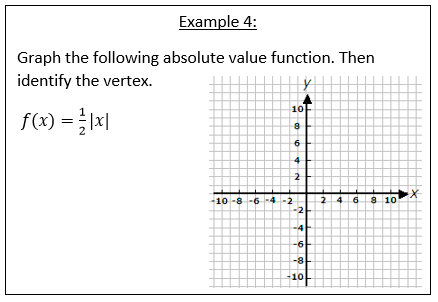
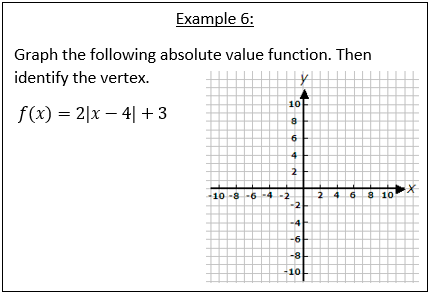
Examples of Graphing Absolute Value Functions in Two Variables with various Transformations
|
|
A2 Section 2.7 Worksheet |
A2 Section 2.7 WS ANSWERS |
If you had any problems with the example videos on this page, or have any comments to make them better, please click the button below.
